
Make a Traffic Speed Dashboard using CSDI Data

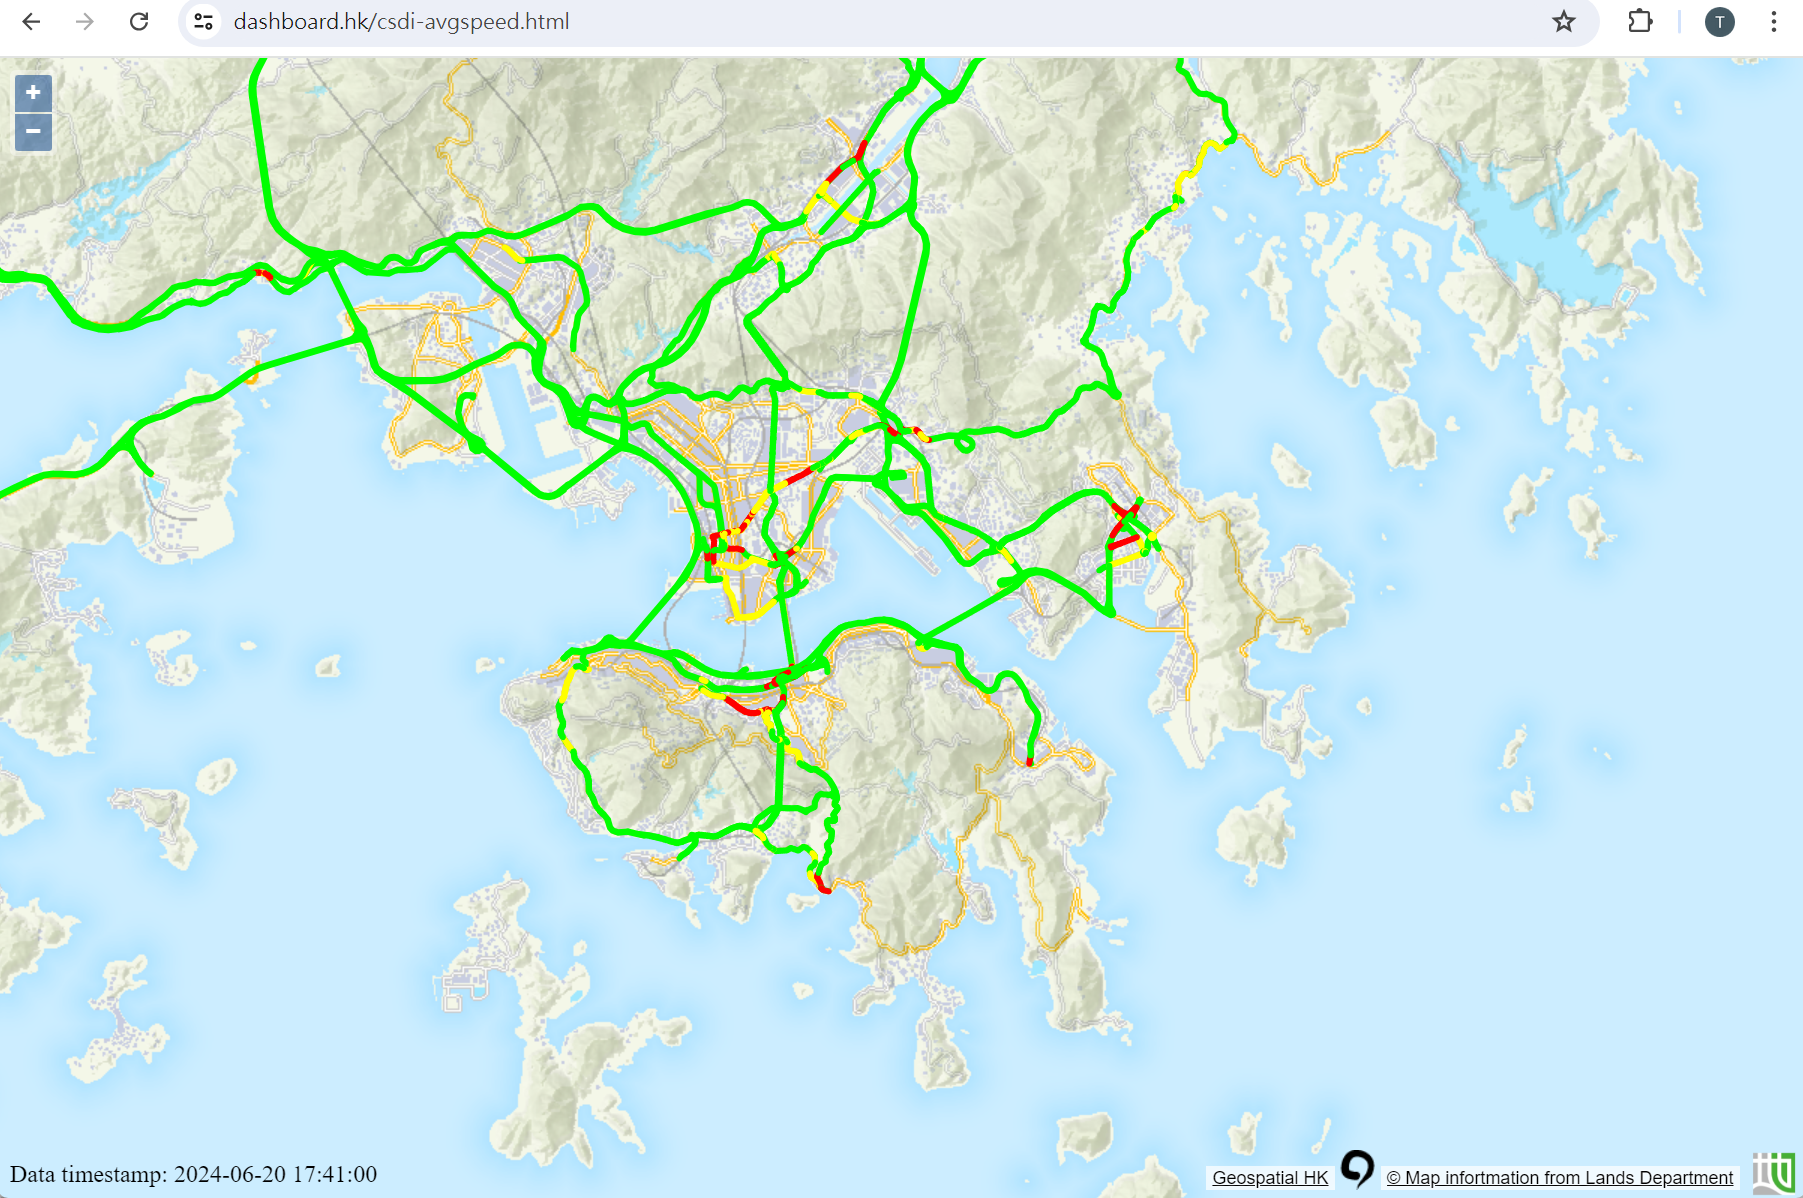
Live demo site: https://dashboard.hk/csdi-avgspeed.html
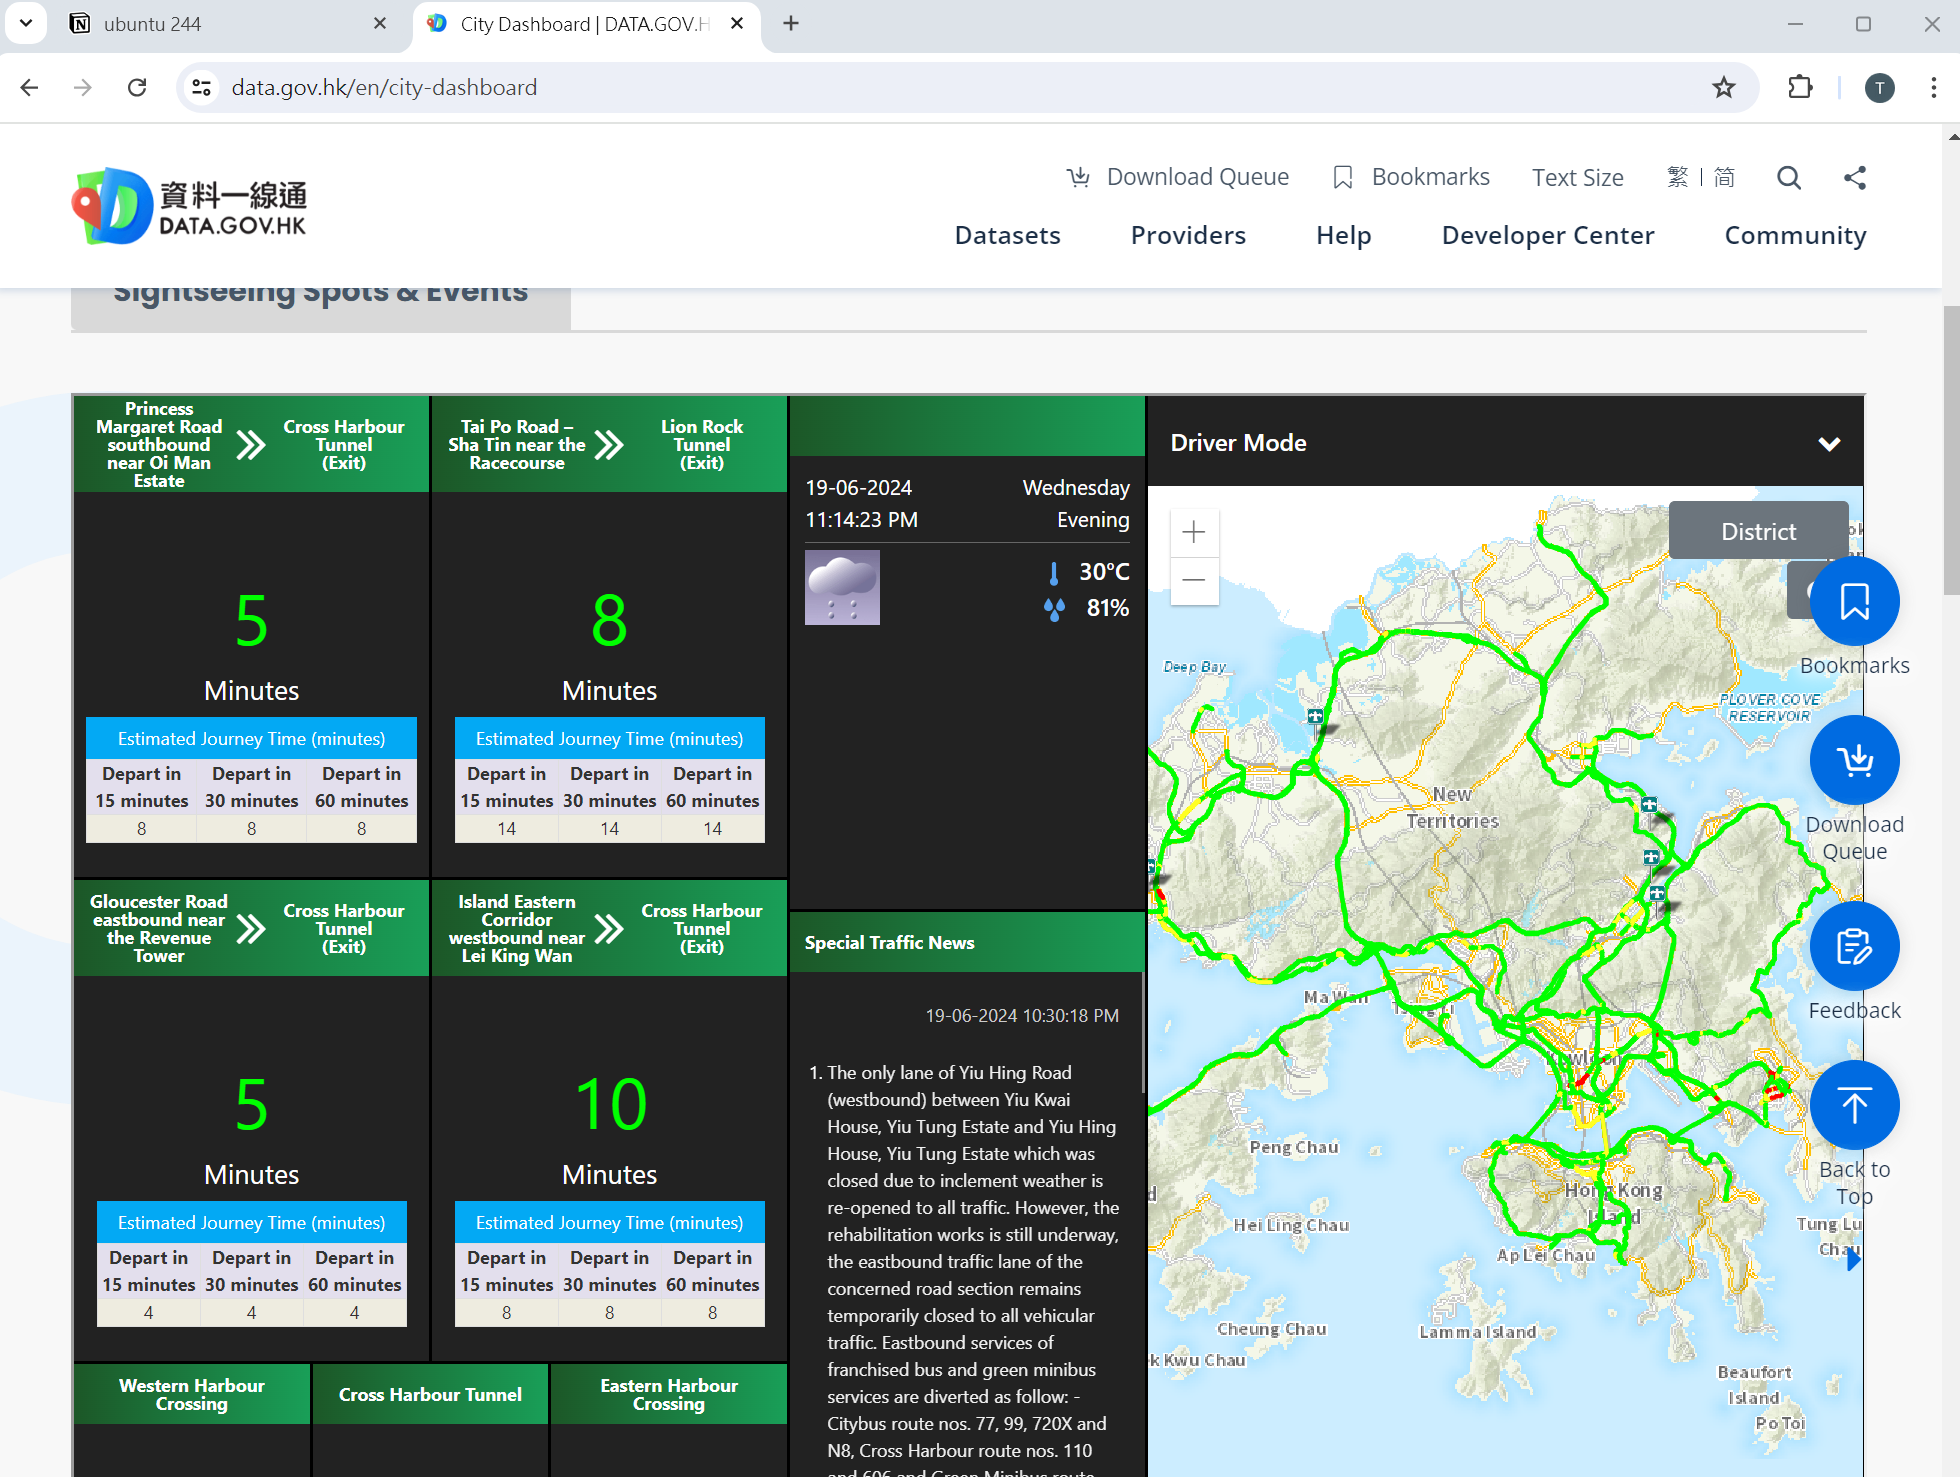
DATA.GOV.HK has some proof of concept dashboards using Government open data, here we will try to make the Traffic Speed Dashboard on our own server.
First, we will need to download the Road Network data from CSDI portal. Go to portal.csdi.gov.hk, and search for "Road Network", download the SHP format.
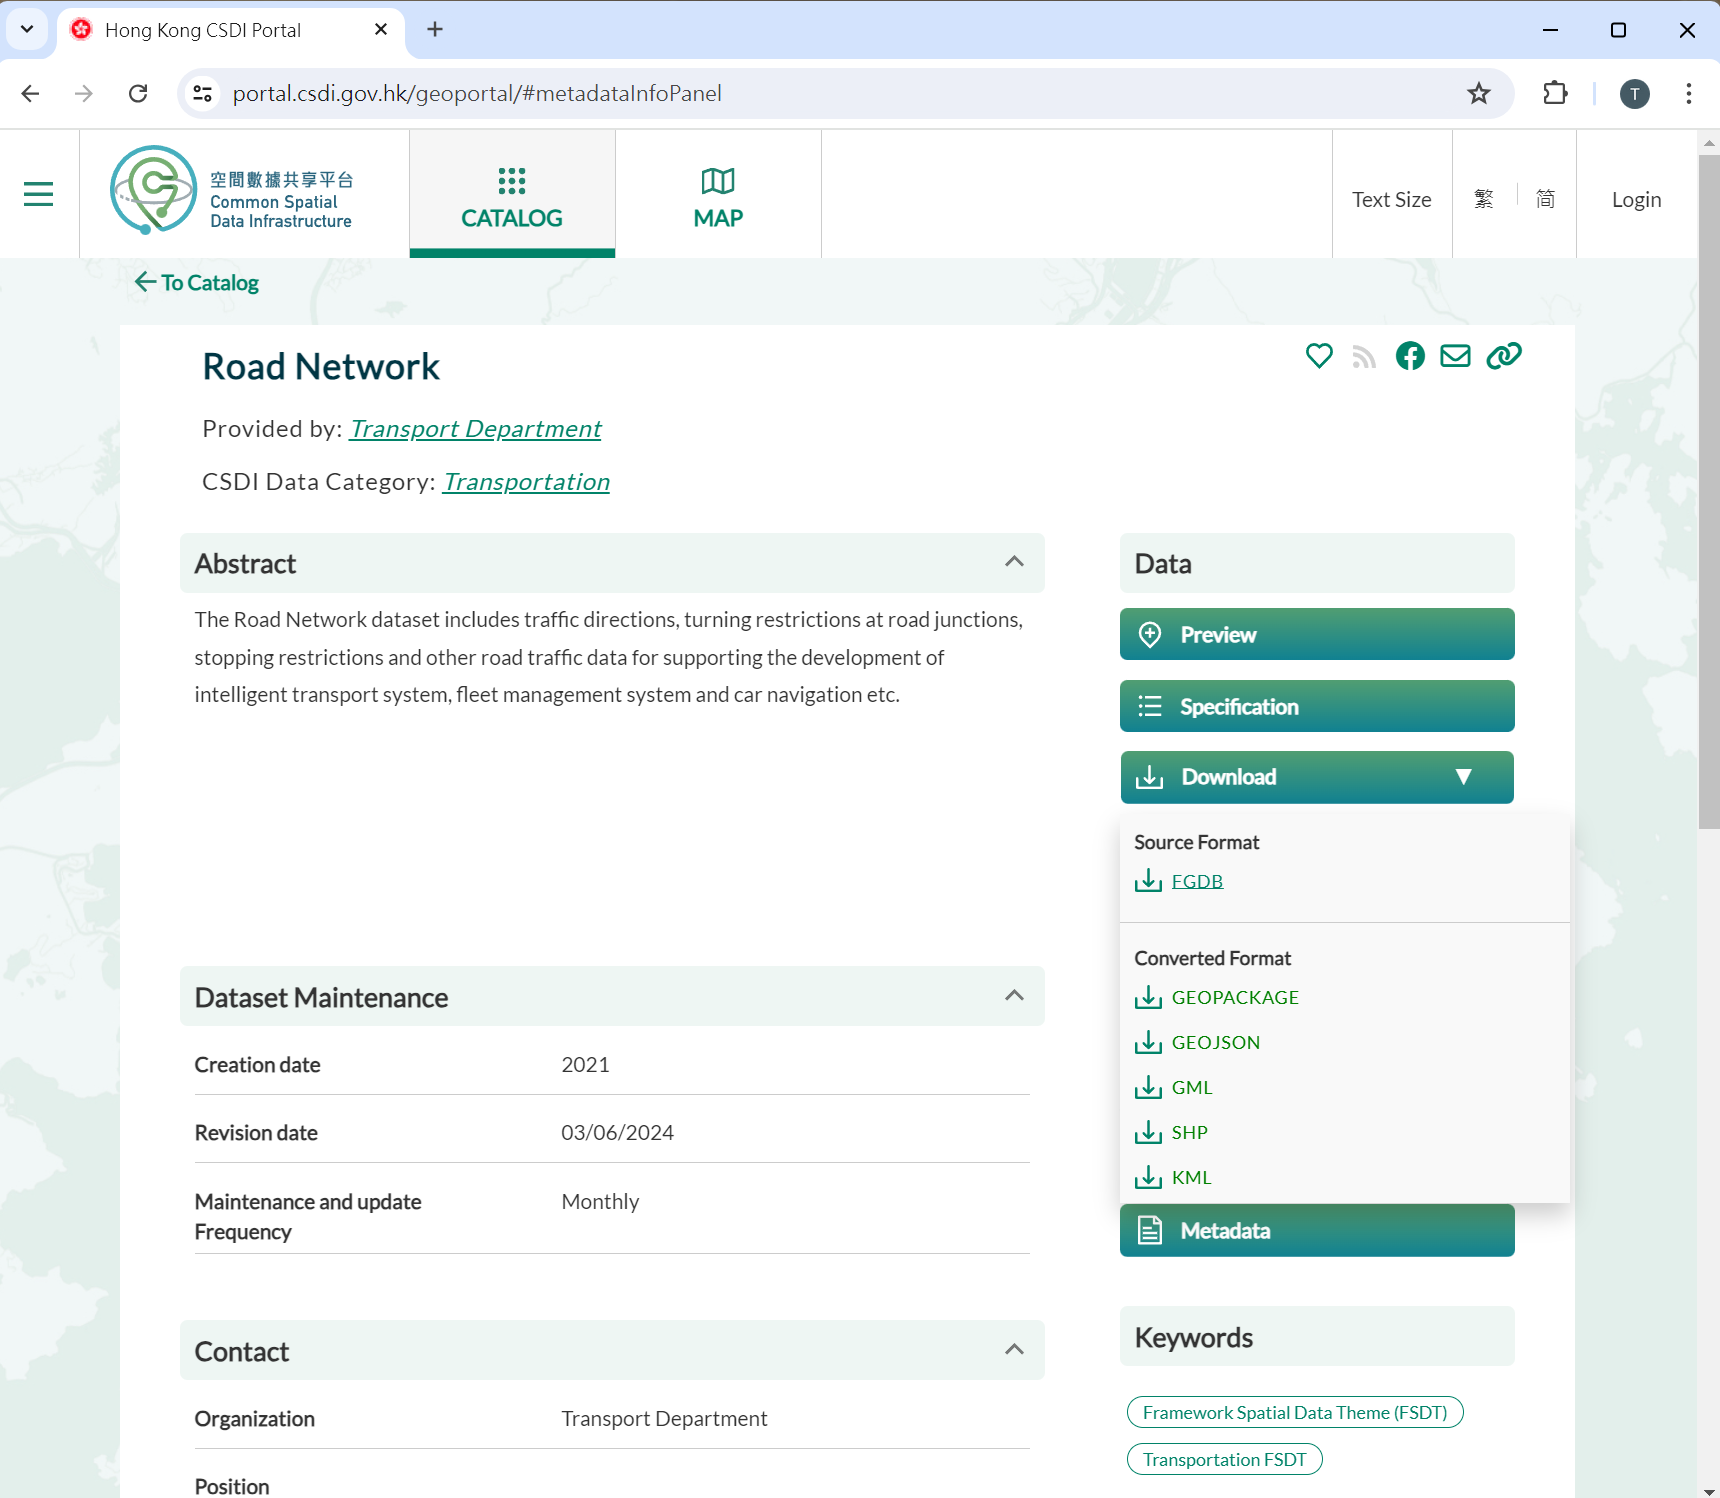
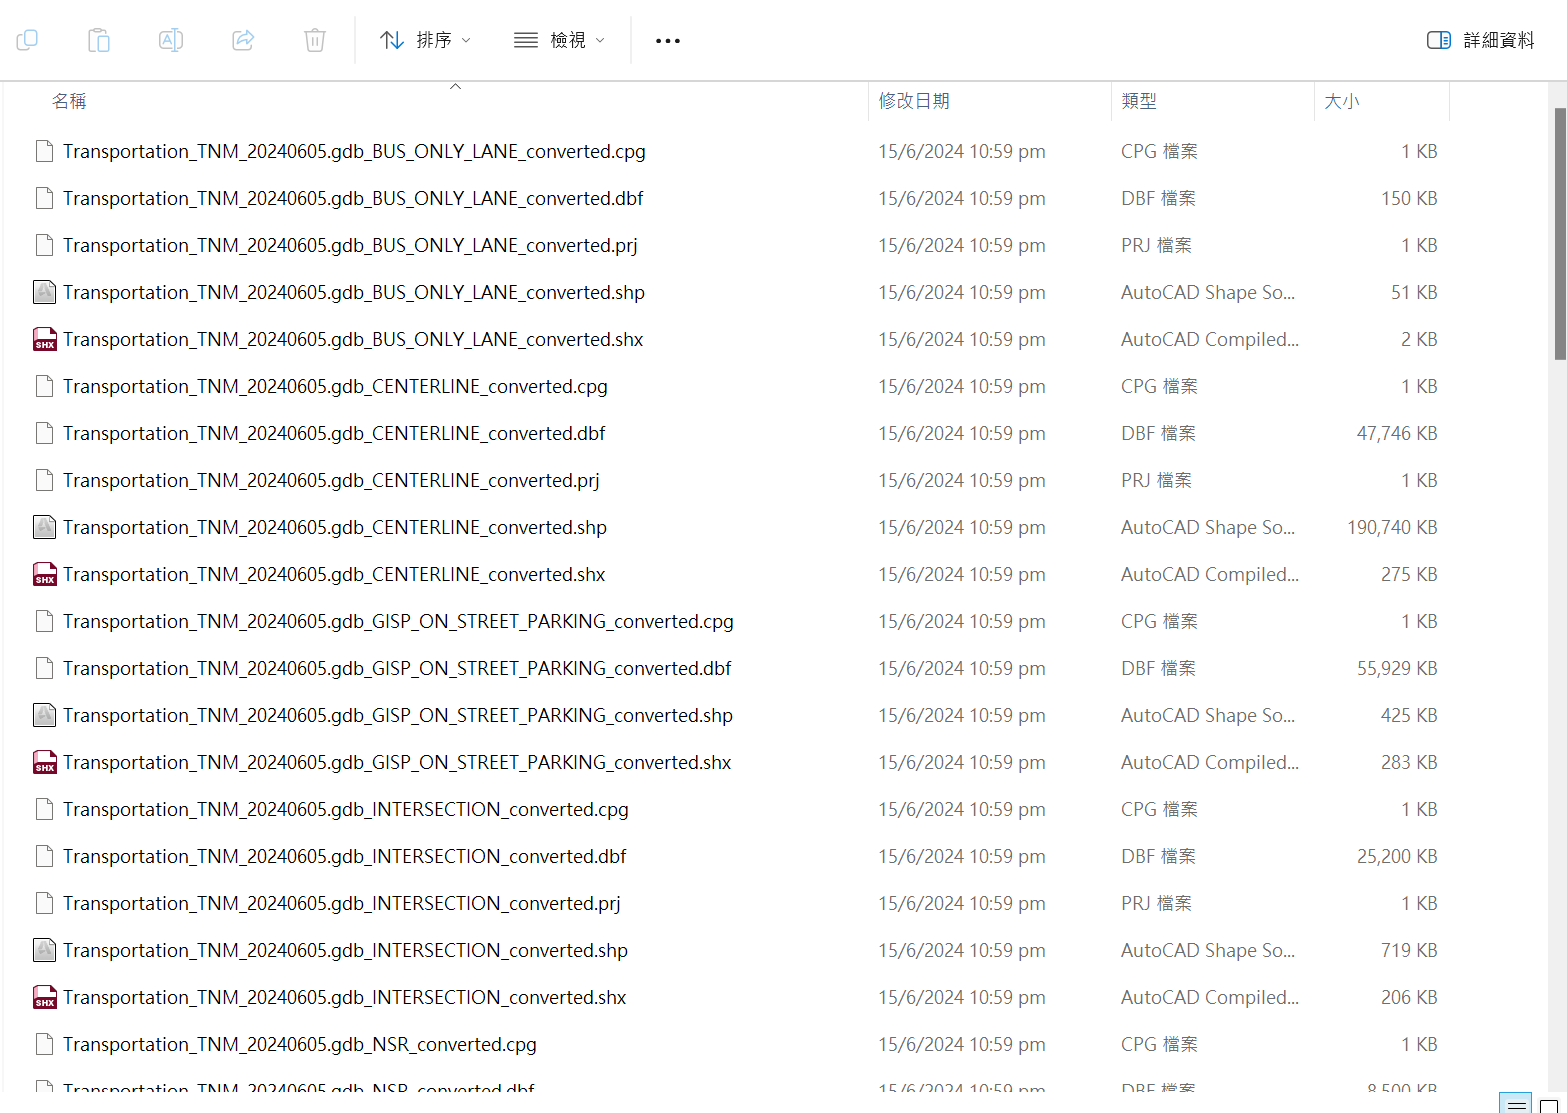
After unzip the file, the data inside is like the following, remember data in SHP file composes of a number of files.
For basemap we are using the CSDI Map API
https://portal.csdi.gov.hk/csdi-webpage/apidoc/TopographicMapAPI
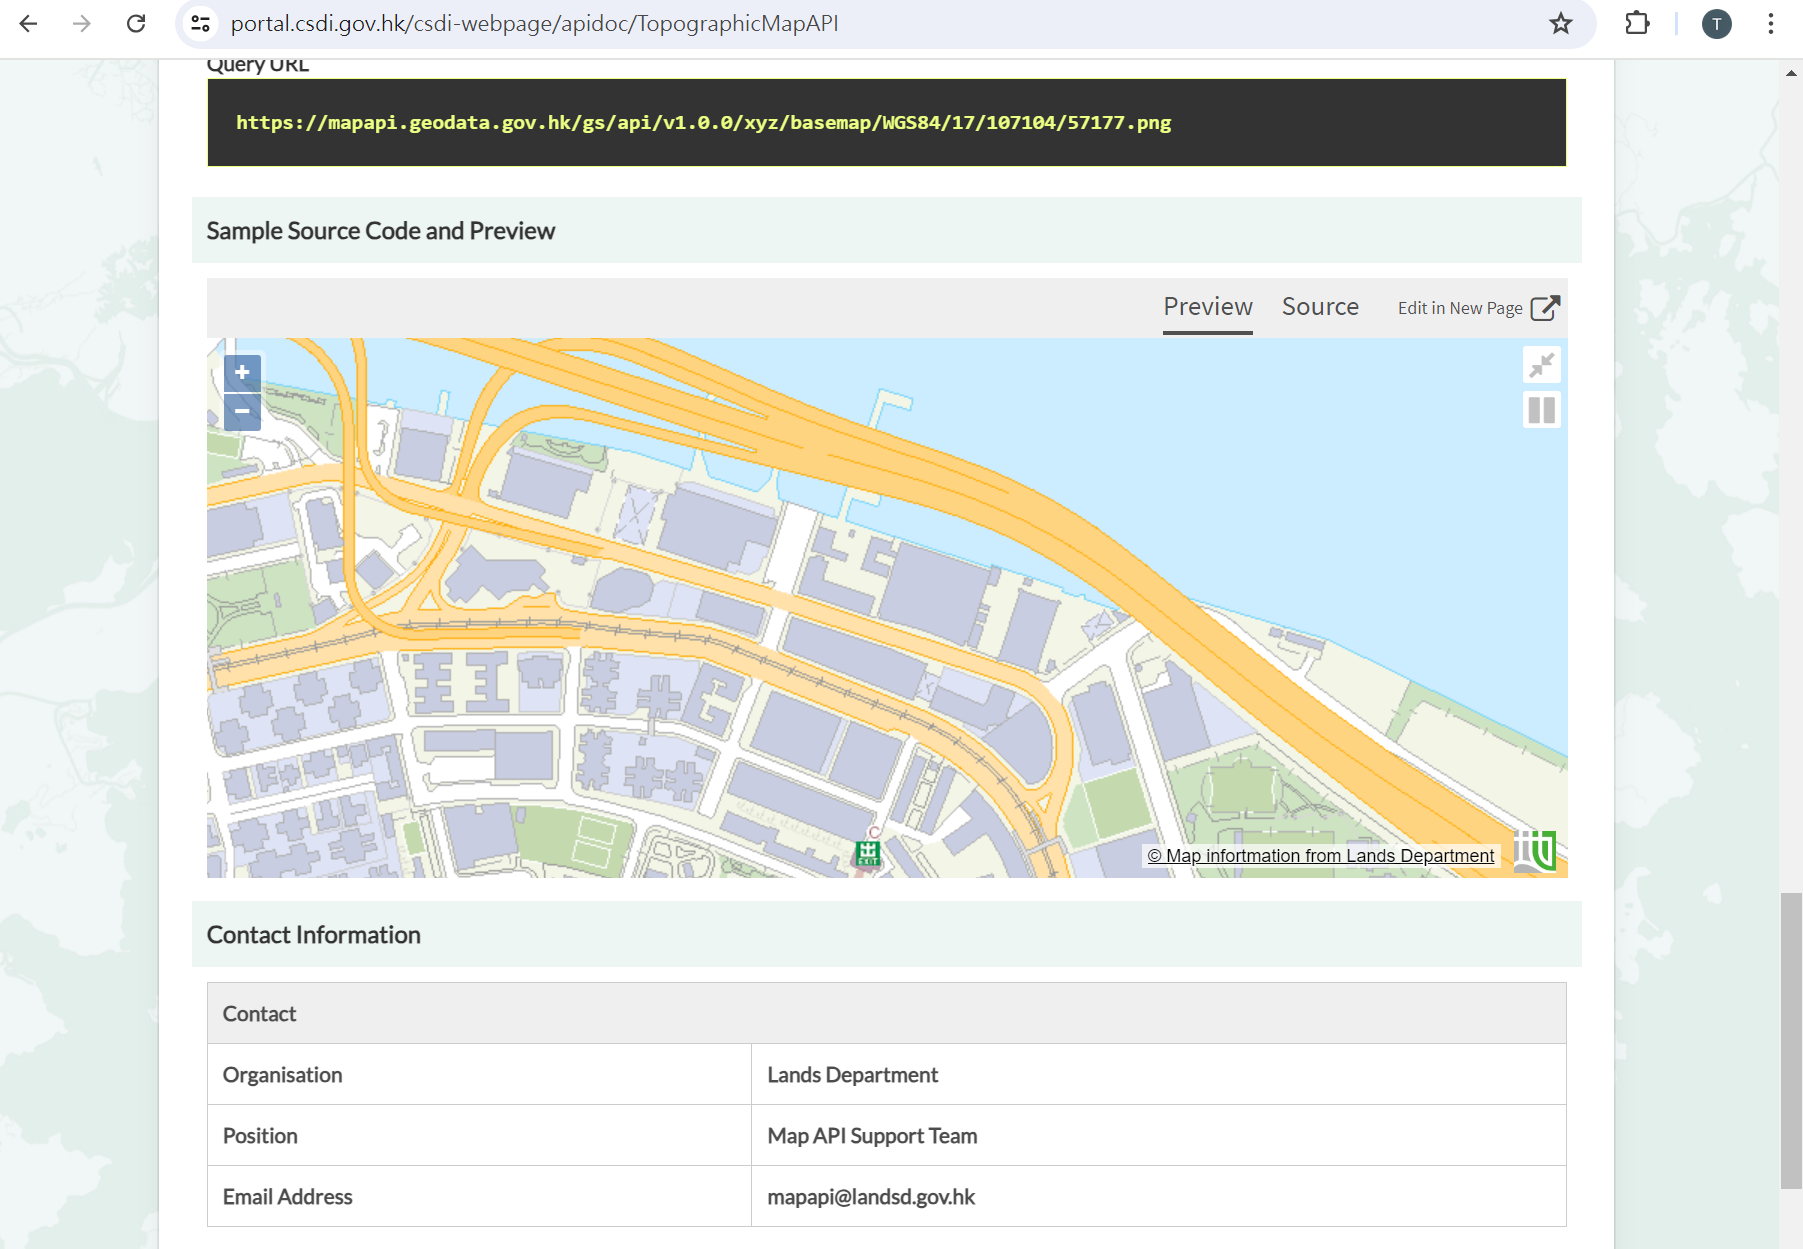
There provide a sample source code base on OpenLayers v4, our development is based on that.
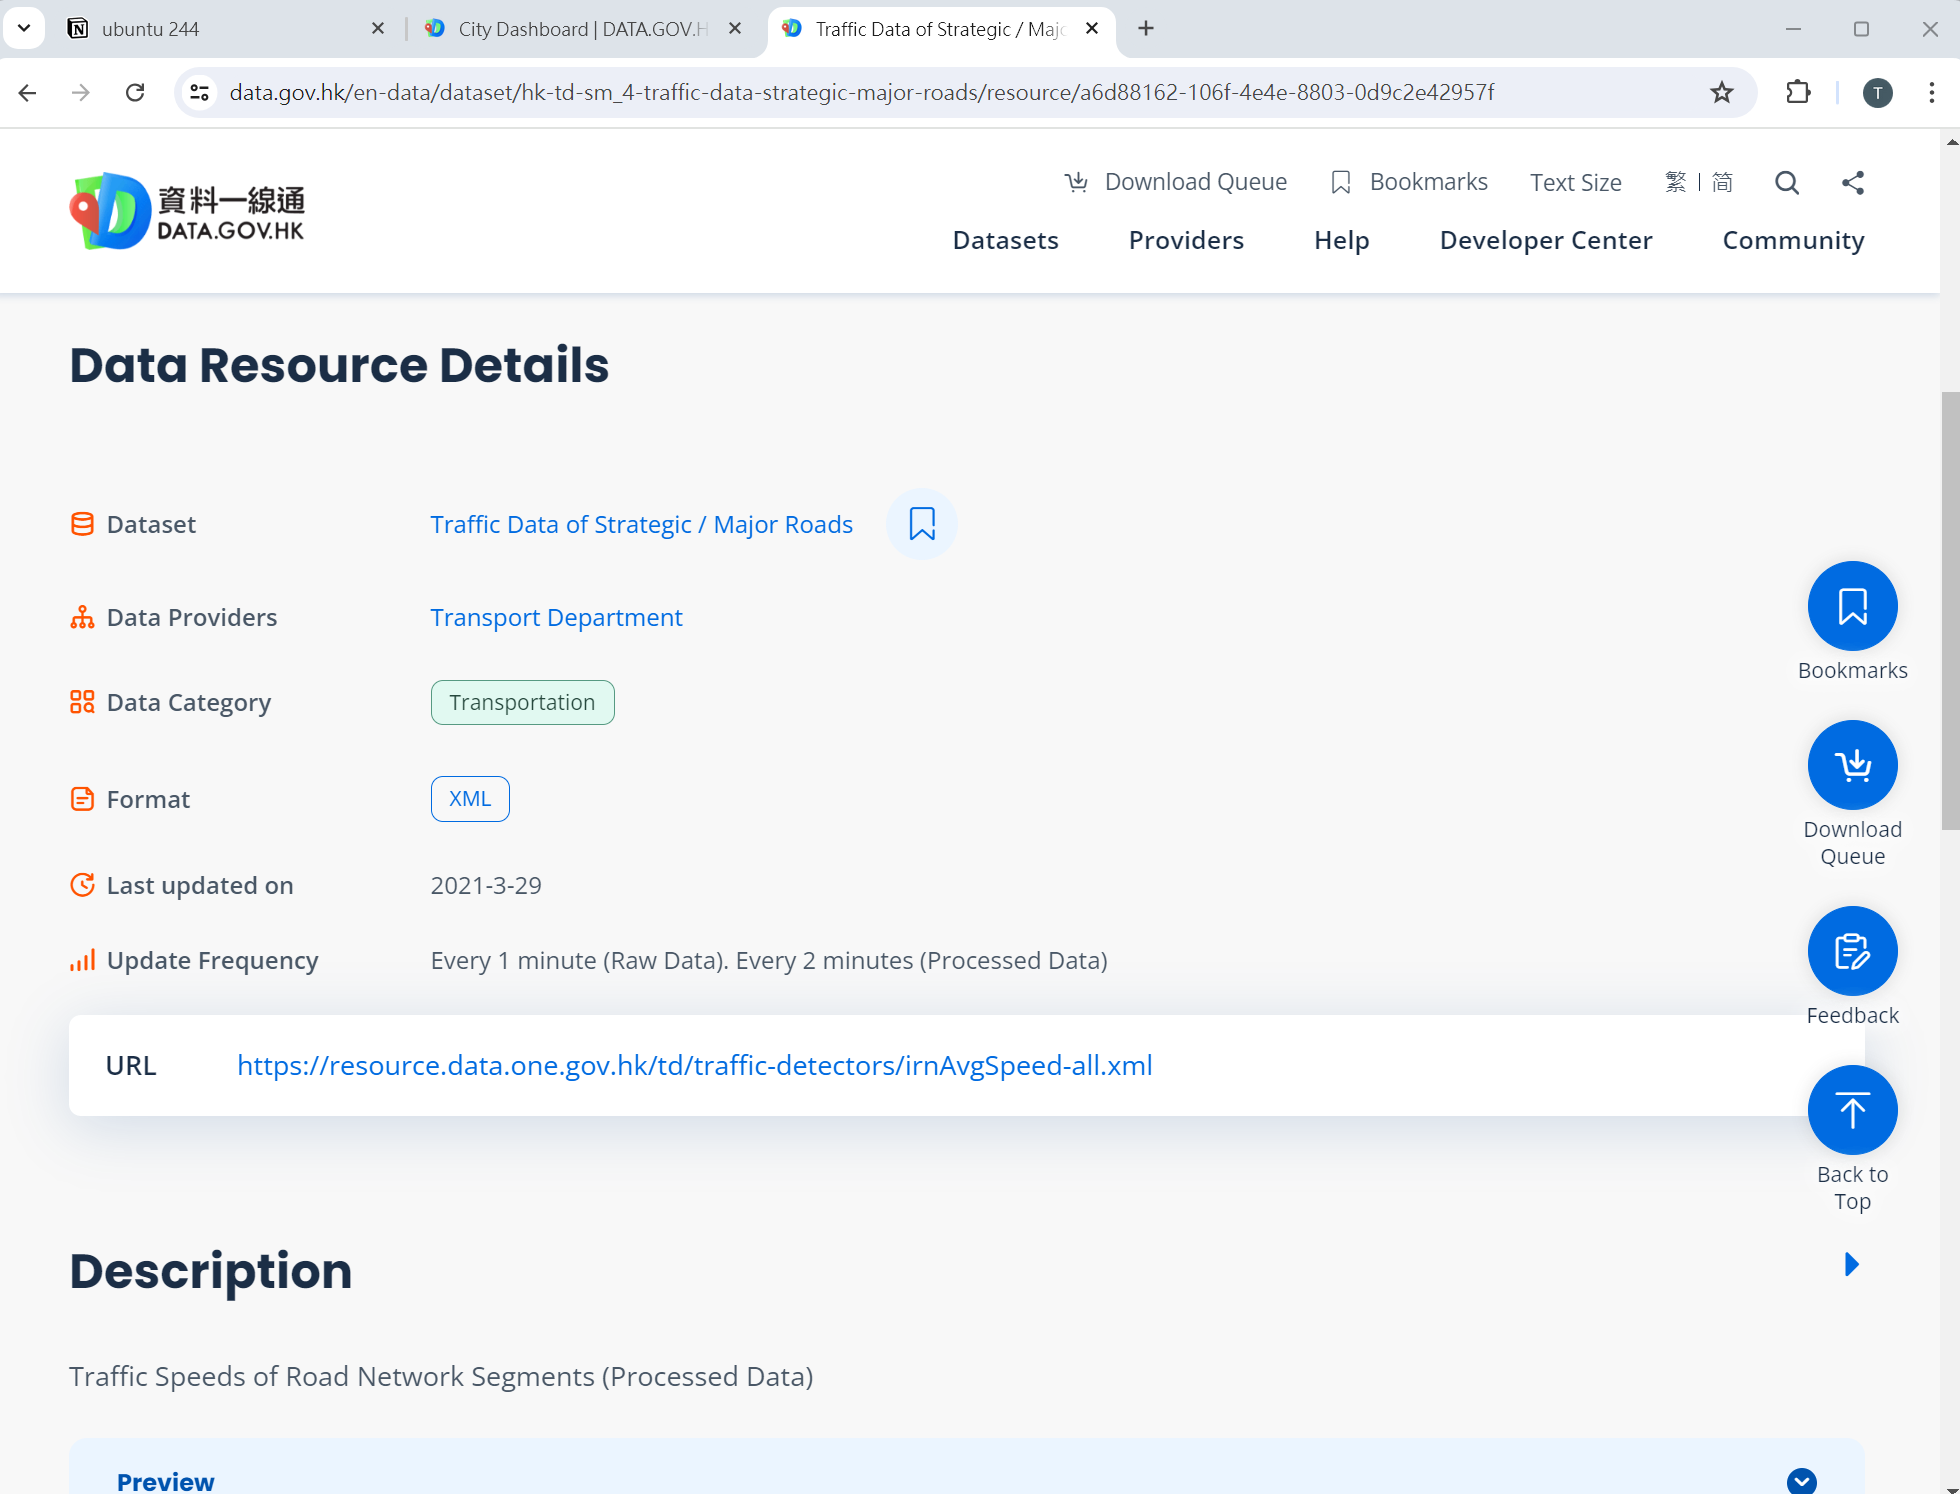
The Traffic Speed data is downloaded from Government Data One portal, the data is updated every 2 minutes (here we use the Processed Data).
We only need the CENTERLINE SHP file from the Road Network dataset, we will load it into the Postgresql database, which is an open source database. We installed that in an Ubuntu Linux server.
We use the ogr2ogr command to load it
ogr2ogr \
-nln centerline \
-nlt PROMOTE_TO_MULTI \
-lco GEOMETRY_NAME=geom \
-lco FID=gid \
-lco PRECISION=NO \
Pg:"dbname=gisdb host=localhost user=pguser port=5432" \
Transportation_TNM_20240605.gdb_CENTERLINE_converted.shp
For detail on how to install the Postgresql, please refer to the following post
https://trac.osgeo.org/postgis/wiki/UsersWikiPostGIS3UbuntuPGSQLApt
We use a PHP program to download the Traffic Speed XML from Data One, combine with the geometry data from the Road Network, and generates a GEOJSON file which has both segments and the traffic speed information. The static GEOJSON will then be read by the OpenLayers UI for displaying the map data. An alternative for serving map data is to use GeoServer, but we try to make it simple in this exercise, we will cover GeoServer in future exercise.
<?php
// Load the XML file
$xml = simplexml_load_file('https://resource.data.one.gov.hk/td/traffic-detectors/irnAvgSpeed-all.xml');

// Check if the file was loaded successfully
if ($xml === false) {
    echo "Failed to load XML file.";
    foreach(libxml_get_errors() as $error) {
        echo "\n", $error->message;
    }
    exit;
}

// Connect to PostgreSQL database
$conn = new PDO('pgsql:host=192.168.0.108;dbname=gisdb','pguser','pwd');


// Build GeoJSON feature collection array
$geojson = array(
   'type'      => 'FeatureCollection',
   'features'  => array()
);


// Iterate through each book and print details
foreach ($xml->segments->segment  as $segment) {

	if ($segment->valid == "Y") {

		$sql = 'SELECT route_id, '.$segment->speed.' as speed, ST_AsGeoJSON(ST_Transform((geom),4326),6) AS geojson FROM centerline where route_id='.$segment->segment_id;

		// Try query or error
		$rs = $conn->query($sql);
		if (!$rs) {
			echo 'An SQL error occured.\n';
			exit;
		}


		// Loop through rows to build feature arrays
		while ($row = $rs->fetch(PDO::FETCH_ASSOC)) {
			$properties = $row;
			// Remove geojson and geometry fields from properties
			unset($properties['geojson']);
			unset($properties['geom']);
			$feature = array(
				 'type' => 'Feature',
				 'geometry' => json_decode($row['geojson'], true),
				 'properties' => $properties
			);
			// Add feature arrays to feature collection array
			array_push($geojson['features'], $feature);
		}
	}
}

file_put_contents('/var/www/html/irnAvgSpeed.json', json_encode($geojson, JSON_NUMERIC_CHECK));

$conn = NULL;

?>
In Ubuntu server we set a cron task to run the above PHP program every 2 minutes
sudo crontab -e

***/2 * * * * /usr/bin/php -f /var/www/html/genjson.php**
Following is the HTML code we use for the map UI which is developed base on the above OpenLayers v4 sample code from CSDI. We created 3 map styles for the road segments to color, lime color for normal speed, yellow for medium speed, and red for slow speed. Following is the Javascript code which decides what style to apply to the segment features in OpenLayers.
        var styles = new ol.style.Style({
          stroke: new ol.style.Stroke({
            color: 'lime',
            width: 4
          })
        });


        var styles2 = new ol.style.Style({
          stroke: new ol.style.Stroke({
            color: 'yellow',
            width: 4
          })
        });

        var styles3 = new ol.style.Style({
          stroke: new ol.style.Stroke({
            color: 'red',
            width: 4
          })
        });

		var styleFunction = function(feature) {
		  var speed = feature.get('speed');
		  if (speed > 30) {
			return [styles];
		  }
		  else if (speed > 17) {
			return [styles2];
		  }
		  else {
			return [styles3];
		  }
		};
Following Javascript will retrieve the data from GEOJSON file (the static file generated by PHP above) every 30 seconds and update the map. Please note we need to convert the projection before overlaying it on map.
		var url = 'irnAvgSpeed.json';

		fetch(url, { cache: "no-store" }).then(function(response) {
		  return response.json();
		}).then(function(json) {

			var vectorSource = new ol.source.Vector({
			  features: (new ol.format.GeoJSON({
				dataProjection: 'EPSG:4326',
				featureProjection: 'EPSG:3857'
			  })).readFeatures(json)
			});

			var vectorLayer = new ol.layer.Vector({
			  source: vectorSource,
			  style: styleFunction
			});

			map.addLayer(vectorLayer);

			$('#datetime').text("Data timestamp: " + json.date + " " + json.time);


			setInterval(function(){

				fetch(url, { cache: "no-store" }).then(function(response) {
				  return response.json();
				}).then(function(json) {

					vectorSource.clear();

					vectorSource.addFeatures((new ol.format.GeoJSON({
					  dataProjection: 'EPSG:4326',
					  featureProjection: 'EPSG:3857'
					})).readFeatures(json));

					vectorSource.refresh();

					$('#datetime').text("Data timestamp: " + json.date + " " + json.time);
				});

			},60000);


        });
Final result:
For full source code please visit our Github repository
https://github.com/geospatialhk
Any comments please email us at info@geospatial.hk
Thanks.